S-Curves are a very important project management tool; they allow the progress of a project to be tracked visually over time and form a historical record of what has happened to date.
What is S-Curve?
S-Curve in the construction project management industry is a display of cumulative costs, man-hours, or other quantities plotted against time. The name derives from the S-like shape of the curve, flatter at the beginning and at the end and steeper in the middle, which is typical of most projects. The beginning represents a slow, cautious but accelerating start, while the end represents a deceleration as the work runs out.
What is Cash Flow In Construction?
Cash flow (S-Curve) is very important for a main contractor or subcontractor, the cash flow graph of expenses and incomes for a construction project typically follows the work in progress for which the contractor will be paid periodically. The markup by the contractor above the estimated expenses is included in the total contract price and the terms of most contracts generally call for monthly reimbursements (Monthly Invoice) of work completed less retainage.
At the beginning of the construction contract, a considerable sum may have been spent in enabling works. The contractor’s cash-out which occurs more or less continuously for the project duration is depicted by a piecewise continuous curve while the receipts (such as progress invoices from the client) are represented by a step function as shown below in the graph.
The clients’ invoices for the work completed are assumed to lag one period behind expenses except that a withholding proportion or remainder is paid at the end of construction. This analysis method is applicable to realistic situations where a time period is represented by one month and the number of time periods is extended to cover delayed receipts as a result of retention.
How To Create an S-Curve Graph in Excel?
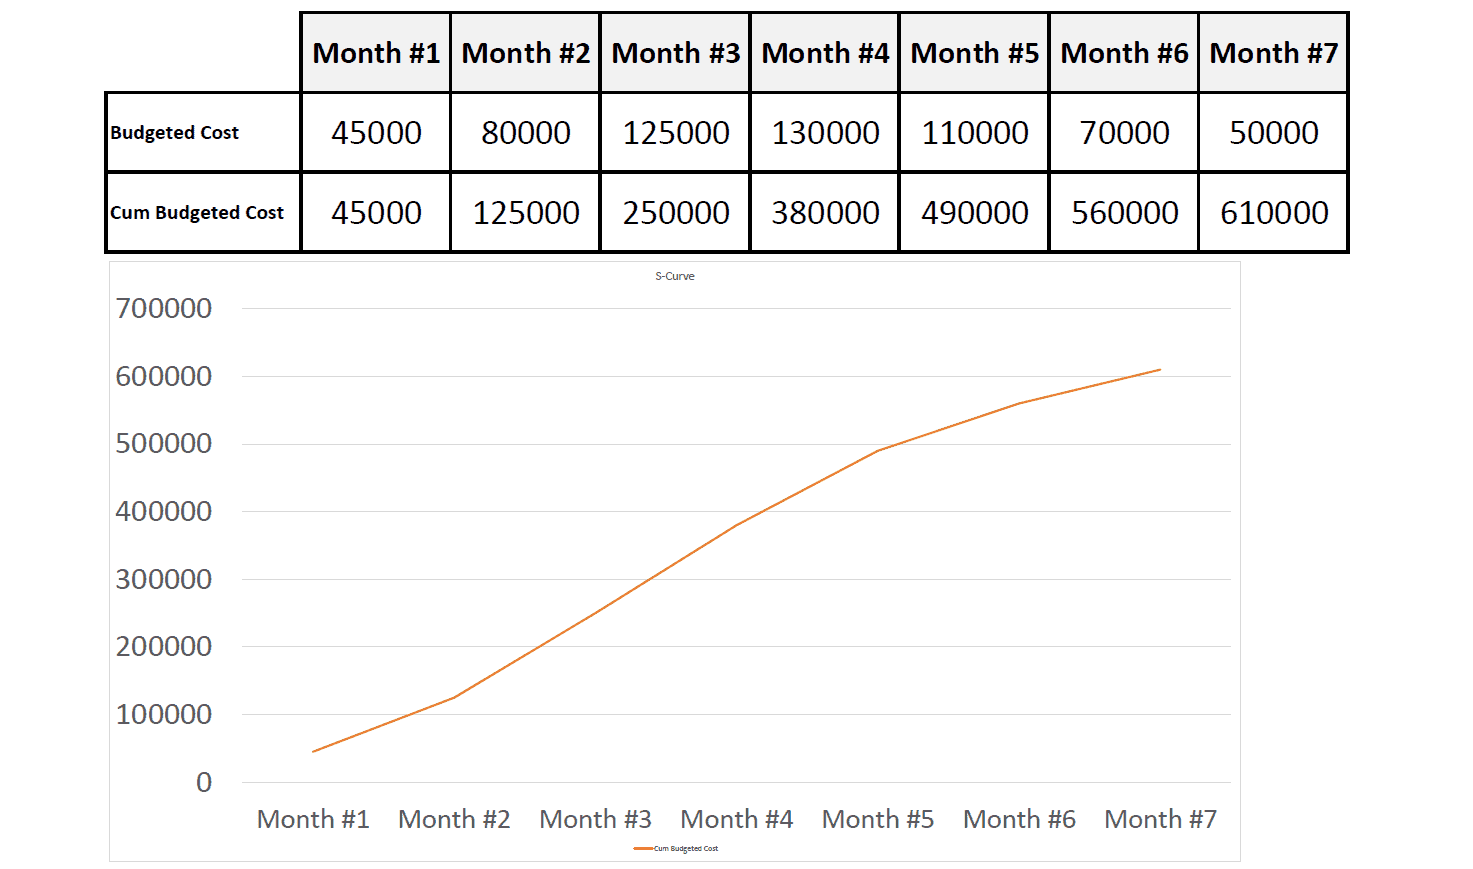
Add the Values for each month
Step #2:
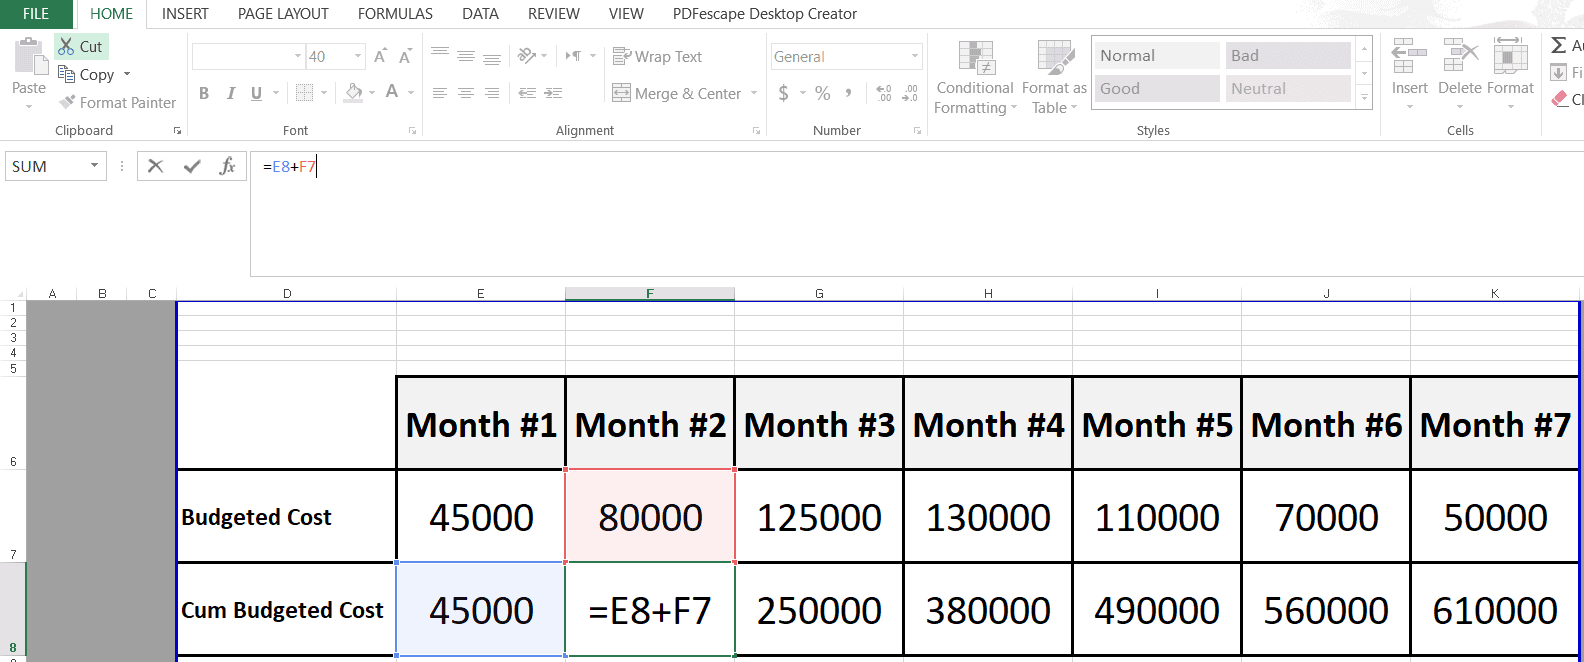
Create an equation for “Cumulative Values”. (e.g. You can download the free excel s-curve template at the end of this article which contains the S Curve formula in the free excel template)
Step #3:
Insert a Chart

Step#4:
Right click on the chart and Click on ” Select Data” , then select the data from the table

After that you will finish creating the S Curve Excel Template (XLS)
Construction Project Cash Flow Template “XLS”
1. This s curve project management excel template can be used for creating a plan with activities linked together to form a critical path
2. This construction s curve excel template can be used to create activities with a resource and cost loaded
3. A baseline of the activities before the project starts.
4. Actual progress is assigned at regular intervals and optionally, actual costs and actual resource
usage is applied
5. The project is rescheduled to determine a new finish date.
Cash Flow S-Curve in Excel Template
- Cash flow S-Curve excel template always show cumulative costs over time
- Cash flow S-Curve template always show the cash flow of the project
Download Template
Recommended Templates
Easy to use S-Curve Excel Template
See Also
Risk Management Plan Template
Cost Benefit Analysis Template