Productivity Definition
Productivity is the measure of the work produced per unit of input (various cost items that are incurred). Although productivity is often thought of as relating to labor only, in practice it relates to any resources used to produce a result.
What is the Learning Curve?
A learning curve is a graph that demonstrates the relationship between performance and cost over a specified period of time, usually to represent the laborer’s repetitive task. The learning curve was defined by psychologist Hermann Ebbinghaus in 1885 and is used as a means of measuring the effectiveness of productivity and cost forecast.
Learning Curve Theory
One of the most important issues in repetitive operations is the learning effect. It is obvious that a repetitive operation offers better opportunities to achieve high productivity. It is recognized that the productivity of labor improves when repetition is involved in an operation.
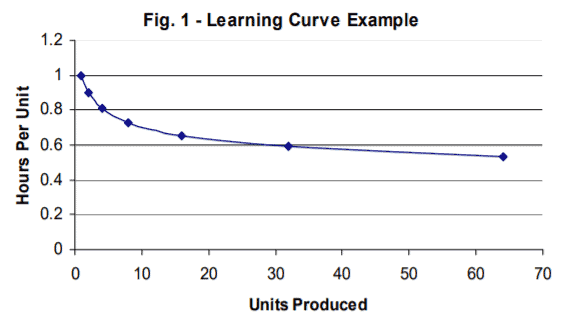
Figure 1 shows a theoretical 85% learning curve. Each time the
number of units produced doubles, direct labor or cost is reduced by 15%. Beyond the
64th unit, the hours required to start to level off.
The learning curve theory is often applied in the construction industry where the work is repetitive & continuous.
For example, when the design calls for repeated utilization of the same concrete forms in a high-rise or multiple building construction, the productivity may be susceptible to learning curve analysis.
The same is true for rebar work, concrete placement, or the rough-in and finish work of the trades, as long as there is a relatively constant percentage reduction in the input required to produce an item as the production quantities double. For example, an 80% learning curve represents a 20% reduction in the time it takes to produce units one and two, an additional 20% reduction in the time it takes to produce units two and four, units four and eight, units eight and sixteen, etc.
Learning Curve Formula
Where:
Y is the average time over the measured duration
a represents the time to complete the task the first time
X represents the total amount of attempts completed
b represents the slope of the function
The formula can be used as a prediction tool to forecast future performance.
The learning curve formula stipulates that the more attempts which are included, the more the overall time will decrease. The leaning curve formula can be used to predict a learner’s rate of learning of a simple task or even help businesses to predict the production rate of a product.
See Also
Cash Flow Analysis
Time Impact Analysis (TIA)
Types Of Construction Contracts