Construction projects vary in size, type, and nature. The efficacy of scheduling methods varies according to the type of project they serve. In general, bar charts are appropriate for small, simple projects.
Line of Balance/Linear Scheduling Method Meaning
CPM networks are used for medium- to large-scale projects with a large number of small activities. Some construction projects, such as roads, earthwork, or utility piping, consist of a few activities (usually in large quantities) that must be completed in the same order or sequence.
Let us consider a project to lay down 5,000 linear feet (LF) of an underground utility pipe. The basic activities are Excavation, Prepare Subbase, Lay Pipe, Backfill, and Compact. If we are to use CPM networks for this project, we can take one of the following two approaches:
1. Create a project with only five large activities and then connect these activities with start-to-start(SS) (with lags) and finish-to-finish(FF) relationships.
2. Divide each major activity into a number of activities (e.g., 50 subactivities) in which each represents a distance of 100 LF and then connect them with finish-to-start(FS) relationships with no lags.
What is the Line of Balance/Linear Scheduling Method?
- Line of Balance (LOB) scheduling or Linear scheduling (LSM) is a method that shows the repetitive work that may exist in a project as a single line on a graph. Unlike a Gantt (Bar) Chart, which shows the duration of a particular activity, a LOB graph shows the rate at which the work that makes up all of the activities has to be undertaken to stay on schedule, the relationship of one processor trade to the subsequent trade or process is defined by the space between the lines. If one group is running behind the time schedule, it will impact the following group & this is shown by the lines intersecting.
- LOB is a simple diagram to show the time and location at which a certain crew will be working on a given operation.
- Line of Balance is a good visual tool that lets us see if a construction program can be achieved with the minimum waiting time between tasks
The purpose of the Line of balance(LOB) or Linear Scheduling Method is to ensure that the many activities of a repetitive production process stay “in balance”, they are producing at a pace that allows an even flow of the items produced through a process & at a speed compatible with the goals set forth in a plan.
The advantages of the Line of Balance (LOB) Technique
- The linear scheduling method shows Clearly the amount of work taking place in a certain area at a specific time of the project.
- Line of Balance(LOB) has the ability to show & optimize the resources used for a large number of repeated activities, executed in several zones or locations.
- It’s Easy for optimization analysis of cost and time analysis because of all the information available for each activity in the project.
- Ease of setup and its superior presentation & visualization.
- Easier to modify, update, and change the time schedule.
- Better managing of all the various main contractors/sub-contractors in the project.
- It allows for simpler resource management & resource optimization functions.
- Visualization of productivity & location of crews.
- It allows construction project/project managers to see, in the middle of a project, whether they can meet the schedule if they continue working as they have been.
- LOB is a Good Visual tool that lets us see if a construction program can be achieved with the minimum waiting time between tasks
Line of Balance Calculation
- The goal of using the Linear scheduling method (LSM) is to achieve a resource-balanced schedule by determining the proper crew size and number of crews to employ in each repetitive activity.
This is done such that:
- The units are delivered at the rate that meets a pre-specified deadline
- The logical CPM network is respected for each unit
- Crews’ work continuity is maintained.
- The analysis also involves determining the start & finish times of all activities in all units and the crews’ assignments.
Types of Diagrams Used in LOB Scheduling Technique
1.Production Diagram: It shows the relationships between activities for a single unit.
2.Objective Diagram: Used to plot the actual or planned number of units produced vs. time.
3.Progress Diagram: This shows the number of units for which the activity has finished.
The CPM-LOB formulation involves:
- Crew synchronization
- Calculating resource needs
- Drawing the LOB schedule
Steps Required to Build a Schedule by Using the LOB/LSM
Three simple steps are necessary to build a schedule by using the LOB/LSM:
1. Determine the work activities, we expect only a few activities in LOB/LSM schedules.
2. Estimate activity productivity rates. Such estimation is similar to determining durations. We still estimate durations, but we are more concerned with production rates.
3. Develop a sequence for the activities, similar to determining logical relationships. All relationships are start to start(SS) (with lags) with finish to finish(FF).
Before applying the LOB/LSM, we must make sure it is the most suitable method.
How the LSM/LOB Works
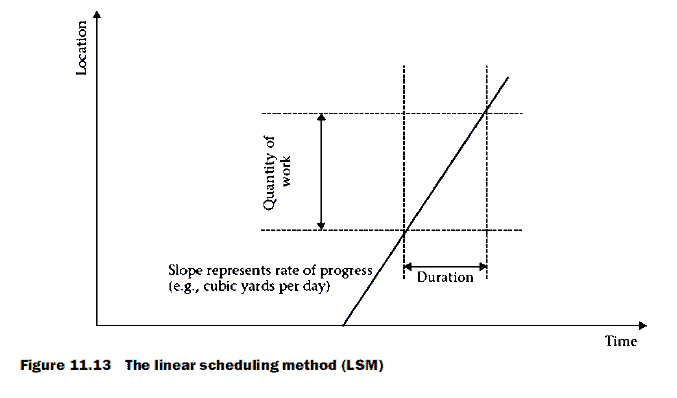
In the LSM, since the x-axis represents time and the y-axis represents distance, the slope represents the ‘‘speed,’’ or rate, of production (Figure 11.13). When we have two or more activities, the productivity rate will differ from one to another.
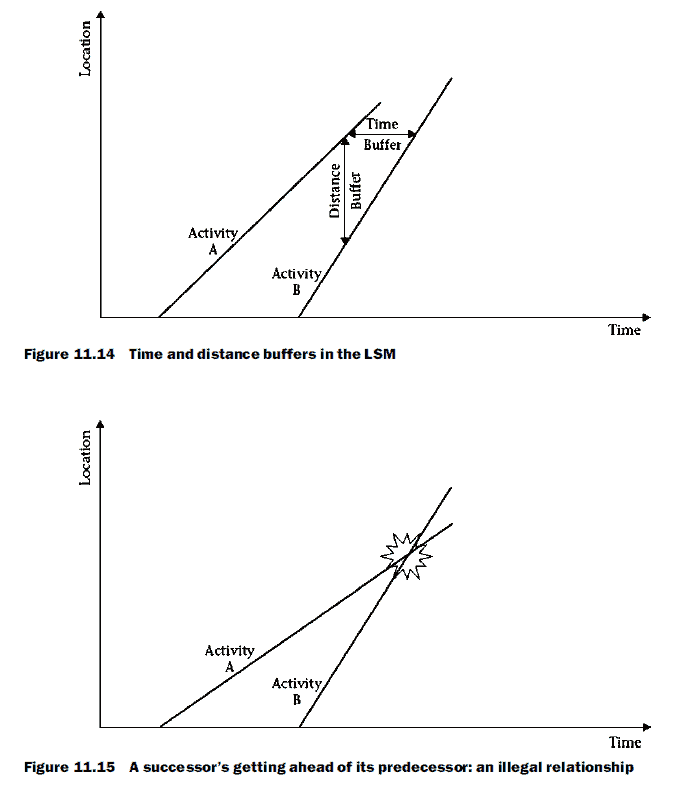
The horizontal distance between two lines represents the float of the earlier activity. In the LOB/LSM, we call it the time buffer. The vertical distance represents the distance separating the two operations. We call it the distance buffer. See Figure 11.14.
Lines are not allowed to intersect because an intersection literally means that the successor has gotten ahead of the predecessor, which is impossible (see Figure 11.15).
Line of Balance(LOB)/ Linear Scheduling Method(LSM) Example
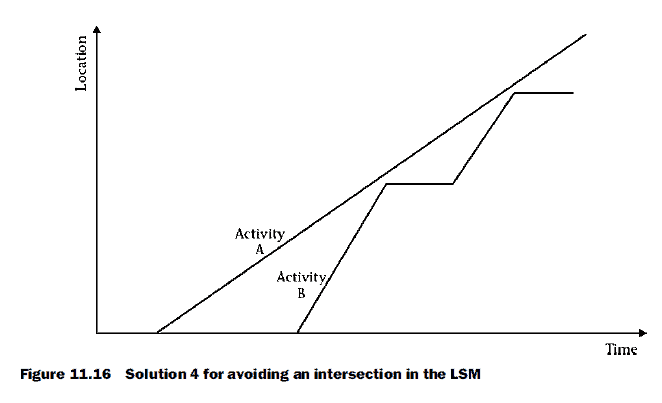
For example, Consider a carpentry crew installing and taping drywall for a total of 10,000 square feet (SF). The production rate for the crew is 500 SF per day for installation and taping. The painting crew is directly behind at a production rate of 800 SF per day.
Assume that the painting crew starts on day 2 (1 day after the carpentry crew started), then, at the end of day 3, the carpentry crew would have finished 500. 3 =
1,500 SF, but the painting crew would have finished 800. 2 = 1,600 SF, which is impossible. There are four solutions for this problem:
1. Speed up the rate of the carpentry crew
2. Slow the rate of the painting crew
3. Make the painting crew start later (calculate the time buffer)
4. Make the painting crew work in intervals: once they catch up with the carpentry team, they stop for a period, resume, and so on
Solution 1 would increase the slope of activity A.
Solution 2 would decrease the slope of activity B.
Solution 3 would increase the time buffer. All three solutions aimed at preventing the intersection of the two lines.
Solution 4 would be represented in an LSM diagram as shown in Figure 11.16. The horizontal lines (slope=0) represent an interruption or stoppage time (no production). If the productivity of the crew
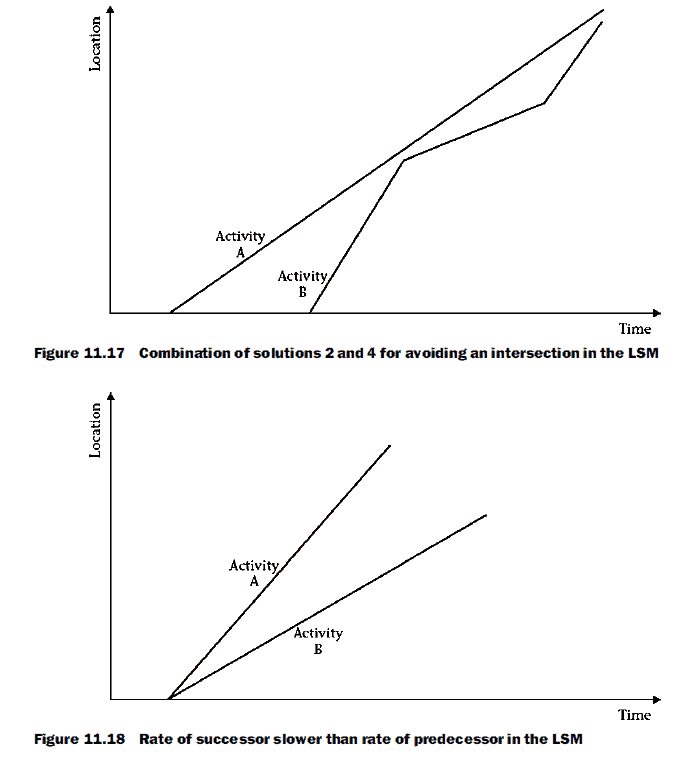
changes, the slope changes too. Therefore, alternatively, instead of completely halting activity B during intervals, we can reduce the crew size to slow the rate until there is a safe time buffer (a combination of solutions 2 and 4; see Figure 11.17).
The time buffer is necessary only if the rate of the successor is faster than the rate of the predecessor. If the rate of the successor is slower than that of the predecessor, the time buffer can start at zero. Naturally, the successor (activity B) will finish after the predecessor (activity A). See Figure 11.18.
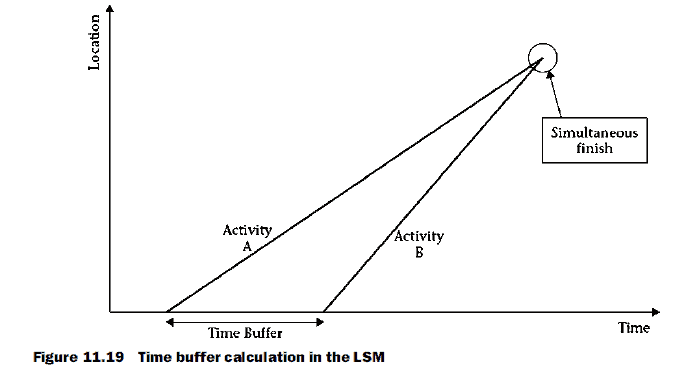
To calculate the time buffer (Figure 11.19), we start from the end: Allow activities A and B to finish simultaneously. Then,
Duration A =Duration B + Time buffer or Time buffer = Duration A – Duration B
With multiple activities, you must consider two activities at a time. Starting from
the beginning, do the following:
1. Compare the durations of activities 1 and 2. If activity 2 has a shorter duration, determine the time buffer from equation 11.10. If activity 2 has a longer duration, there is no need for a time buffer (practically, we need a minimum buffer because a predecessor and a successor cannot start at exactly the same time).
2. Repeat step 1 for activities 2 and 3 and so on.
References:
Construction Project Scheduling and Control, 2nd Edition, Saleh A. Mubarak
See Also
Critical Path Time Calculation
Primavera P6 Tricks
FIDIC LETTERS BY CONTRACTOR
Excel S-CURVE TEMPLATE