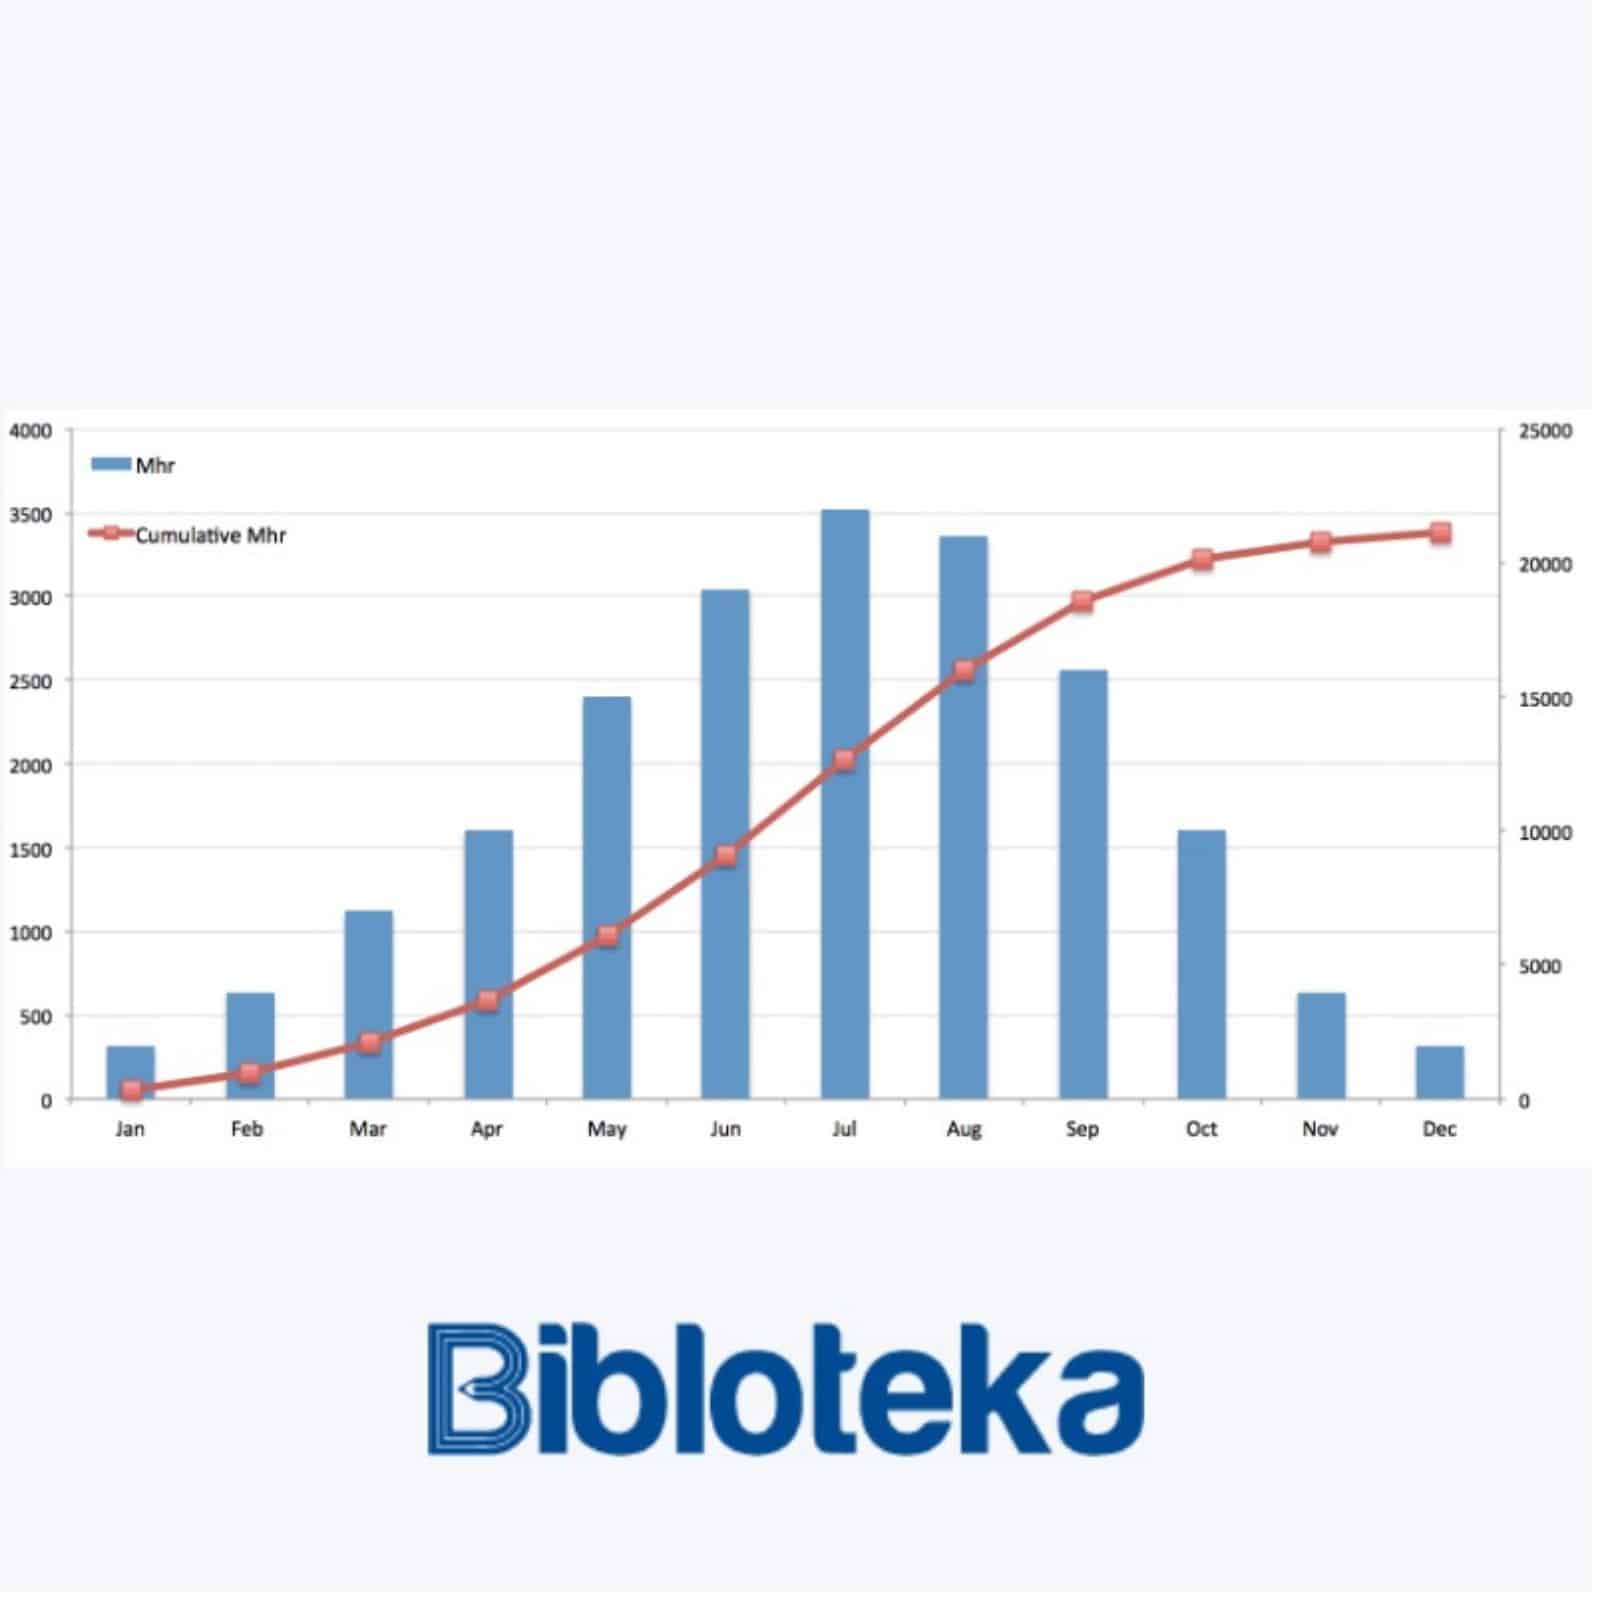
Description
The S-Curve is a type of curve that displays a graphical report of a project’s cumulative progress with respect to time and the growth of one variable in terms of another, often expressed in units of time. It is beneficial for real-estate builders and developers to track and implement different phases of the project in their ongoing building construction project, where it will help in finishing the ongoing project within the scheduled time and budget. It is also useful in the IT and pharmaceutical industries to keep track of project schedules and costs (With daily progress report).
With the S CURVE implementation (a productivity measure), you can easily keep track of project progress on a daily or monthly basis.
USES OF S CURVES
Earned Value Management is the best implementation of S curves. A tool that assists the project manager and team in quickly understanding the variance in any project.
Earned value management helps to identify slippages, which notifies the team to the need to negotiate. It is a comprehensive set of ongoing project data that tracks in the best-case scenarios. More importantly, by using S curves, anyone on the team can quickly understand the status.
The main uses of S-curves in construction include:
- Project progress Vs the planned schedule
- Actual costs Vs budgeted costs
- Costs Vs progress as a measure productivity
- Any type of production activity, such as the amount of road paved, concrete delivered, floors added, and so on.
With this highly customizable S-Curve excel template graph, you can modify S-Curve template. Get This S-Curve Excel Template Graph NOW.
Features of Our S-Curve Excel Template
- You can use this S-Curve template easily to fit your project
- Graphical Chart for Budgeted Cost and Actual Cost
- The best S-Curve excel template graph that can be used in any project easily


