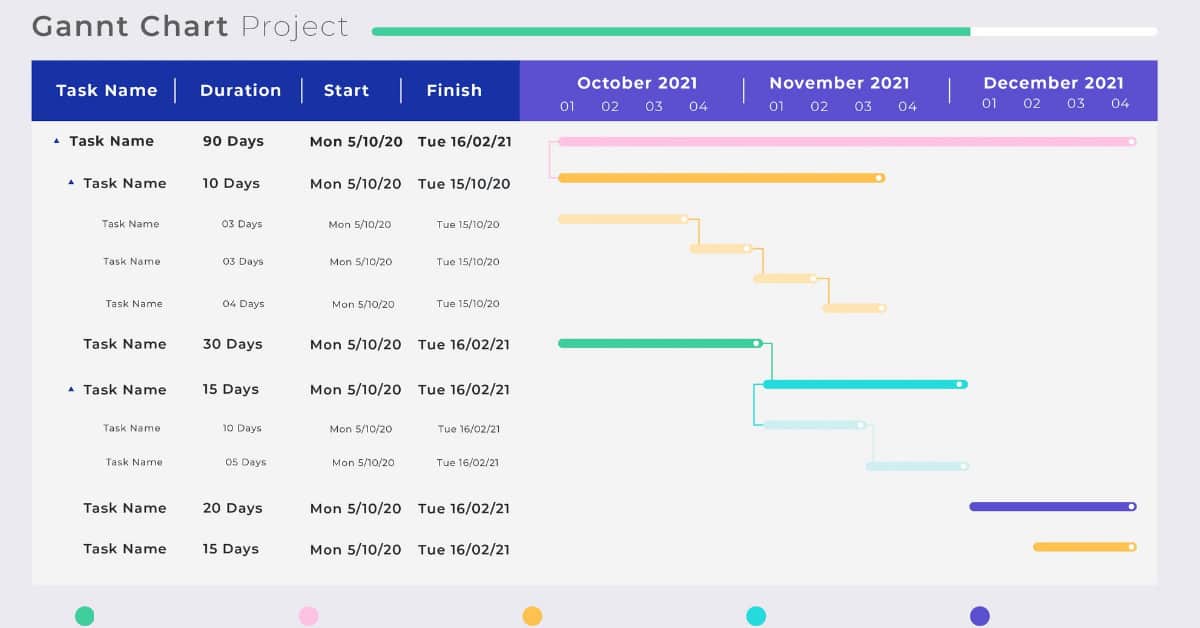
A Gantt chart is a project management tool that depicts a project schedule. It is typically divided into two sections: the left side contains a list of tasks, and the right side contains a timeline with schedule bars that visualize work. The Gantt chart can also include task start and end dates, milestones, task dependencies, and assignees.
What is a Gantt Chart?
Gantt chart is a visual view of tasks/activities scheduled over time. Gantt charts are used for planning projects of all sizes and they are a useful way of showing what work is scheduled to be done on a specific day. They also help you view the start & end dates of a project in a simple view.
The History of Gantt Charts
The first project management bar chart was invented in 1896 by Karol Adamiecki.
A quick history of Gantt charts:
- 1896: Karol Adamiecki creates the first project management bar chart: the Harmonogram, a precursor to the modern Gantt chart.
- 1931: Adamiecki publishes the Harmonogram (but in Polish with limited exposure).
- 1910-1915: Henry Gantt publishes his own system in project management, the Gantt chart.
- Present Days: Gantt charts or bar charts are the preferred tool for managing projects of all types and sizes.
Features of Gantt Chart
On Gantt Chart, you can easily see:
- Start and Finish dates for activities.
- Project milestones.
- Dependencies between activities.
- The person assigned to each activity.
- Duration of each activity
Advantages of Gantt Chart
- You can know the project’s start date.
- You can know what the project activities are.
- You can see who is working on each activity.
- You can see when tasks start and finish.
- You can check how long each task will take
- You can check how activities group together, overlap, and link with each other
- You can see the end date of the project.
- Excel Gantt chart template saves your time by organizing the plan of your project & tackling the tedious planning work for you.
- All you need to do is add your activities & the dates, and you’ll have a presentation-quality Excel Gantt chart.
Who Use Gantt Charts
- Project Managers
- General Managers
- Team Leaders
- Operations Managers
- Scheduling managers
- Work Managers
- Marketing Managers
- CTOs & CEOs
Why use a Gantt chart?
A Gantt chart is used for the following activities:
- Establish the initial project time schedule – who is going to do what, when and how long will it take.
- Allocate the resources of the project- ensure everyone knows who is responsible for what.
- Make project adjustments – the initial plan will need many adjustments.
- Monitor and report progress – helps you stay on schedule.
- Control and communicate the schedule – clear visuals for stakeholders and participants.
- Display milestones – shows key events.
- Identify and report problems – As everything is depicted visually you can immediately see what should have been achieved by a certain date and, if the project is behind schedule, you can take action to bring it back on course.
Download Template
See Also
3-week lookahead template
S-CURVE EXCEL
Monthly Cash Flow Template


